-
E-mail
2881392112@qq.com
-
Phone
18761595061
-
Address
No. 5, ASEAN Road, Nanzha Street, Jiangyin City, Jiangsu Province
Product Categories
Jiangsu Ankerui Electric Appliance Manufacturing Co., Ltd
How much does the energy consumption monitoring system for domestic universities cost
NegotiableUpdate on 01/17
- Model
- Nature of the Manufacturer
- Producers
- Product Category
- Place of Origin
Overview
The college campus IoT energy consumption monitoring system is a user side energy management and analysis system that adds centralized collection and analysis of water, gas, coal, oil, heat (cold), and other energy sources on the basis of the electric energy management system. By subdividing and summarizing all energy consumption on the user side, it displays the usage and consumption of various energy sources to management personnel or decision-makers through intuitive data and charts, making it easy to identify high energy consumption points or unreasonable energy consumption habits, effectively saving energy, and providing accurate data support for users to further energy-saving renovations or equipment upgrades.
Product Details
Ankrui Chen Cong
system architecture
Acrel-5000University Campus IoT Energy Consumption Monitoring SystemUsing computers, communication equipment, and measurement and control units as basic tools, and adopting one or more combination of fieldbus, fiber optic ring network, or wireless communication based on the actual situation on site, it provides a basic platform for real-time data collection, remote management, and control of large public buildings. It can form any complex monitoring system with detection equipment. Adopting an object-oriented layered, hierarchical, and distributed intelligent integrated structure that is open, networked, modular, and configurable. Establish the following hierarchical structure:

Acrel-5000University Campus IoT Energy Consumption Monitoring SystemSystem functions
1) System Overview
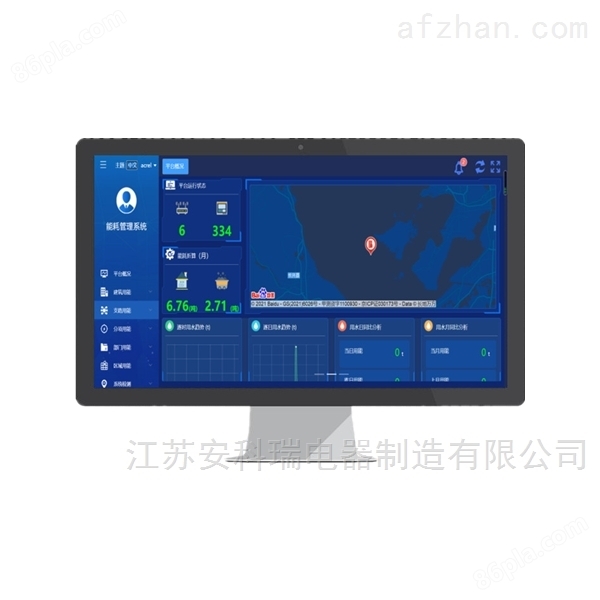
Platform operation status, monthly energy consumption conversion, map navigation, hourly and monthly curves of each energy consumption, and year-on-year analysis of energy consumption for the current day and month are displayed on a rolling basis.
2) Energy consumption overview
Compare the energy consumption of buildings, departments, regions, branches, and classified items, supporting hourly trends for the day, daily trend curves for the month, comparison of energy consumption statistics for different time periods, and comparison of total energy consumption on a month on month basis.

3) Energy consumption statistics
Statistics of classified energy consumption for buildings, regions, sub items, branches, and other structures in the form of daily, monthly, and annual reports. Support for exporting report data to Excel and selecting building data to generate bar charts.

4) Multiple rate statistics
The compound rate report conducts statistical analysis on the peak, off peak, off peak, and off peak electricity consumption and cost expenses of different branches under a single building on a daily, monthly, and annual basis. Support data export to EXCEL.

5) Year on year analysis
Perform year-on-year analysis of energy consumption data for buildings, sub items, regions, branches, etc. by combining graphs and reports on a daily, monthly, and yearly basis.

6) Energy Flow Chart
The energy flow chart displays the energy flow of various types of energy from the source to the end during the time period of a single building, and supports viewing by original value and conversion value.

7) Distribution monitoring/pipeline network diagram
Display important node data in the structure through a primary diagram of the substation distribution structure or a building water and gas pipeline network diagram, to facilitate users' understanding of energy operation parameters.

8) Nighttime energy consumption analysis
Nighttime energy consumption is compared and analyzed in the form of tables, curves, pie charts, etc. between the energy consumption of selected branch classification during working hours and non working hours, and supports exporting reports.

9) 3D Display
Display project site simulation diagrams through 3D graphics to dynamically display building or equipment data in a more intuitive way.

10) Equipment management
Equipment management includes functions such as equipment type, equipment ledger, and maintenance records. Assist users in managing devices reasonably and ensuring their operation.

11) User Report
The user report automatically calculates the month on month trend of energy usage for selected buildings and provides simple energy consumption analysis results. It also provides separate multi rate energy consumption analysis for electricity consumption, and the report is editable.

System hardware configuration


Similar Product Recommend