-
E-mail
2103324506@qq.com
-
Phone
19957899817
-
Address
Room 4178, Building 2, No. 1197 Bin'an Road, Changhe Street, Binjiang District, Hangzhou City
Product Categories
Hangzhou Shangsheng Instrument Co., Ltd
Fully Automated Seed Analysis System
NegotiableUpdate on 01/17
- Model
- Nature of the Manufacturer
- Producers
- Product Category
- Place of Origin
Overview
Seed phenotype analysis system image acquisition: Images are obtained through a 5-megapixel color highlighter, which can be set to capture seeds at regular intervals for a long time.
Product Details
Seed Phenotype Analysis System
TS-G
1.image acquisition:By using a 5-megapixel color highlighter to capture images, it is possible to set a time interval for long-term and continuous timed shooting of seeds.
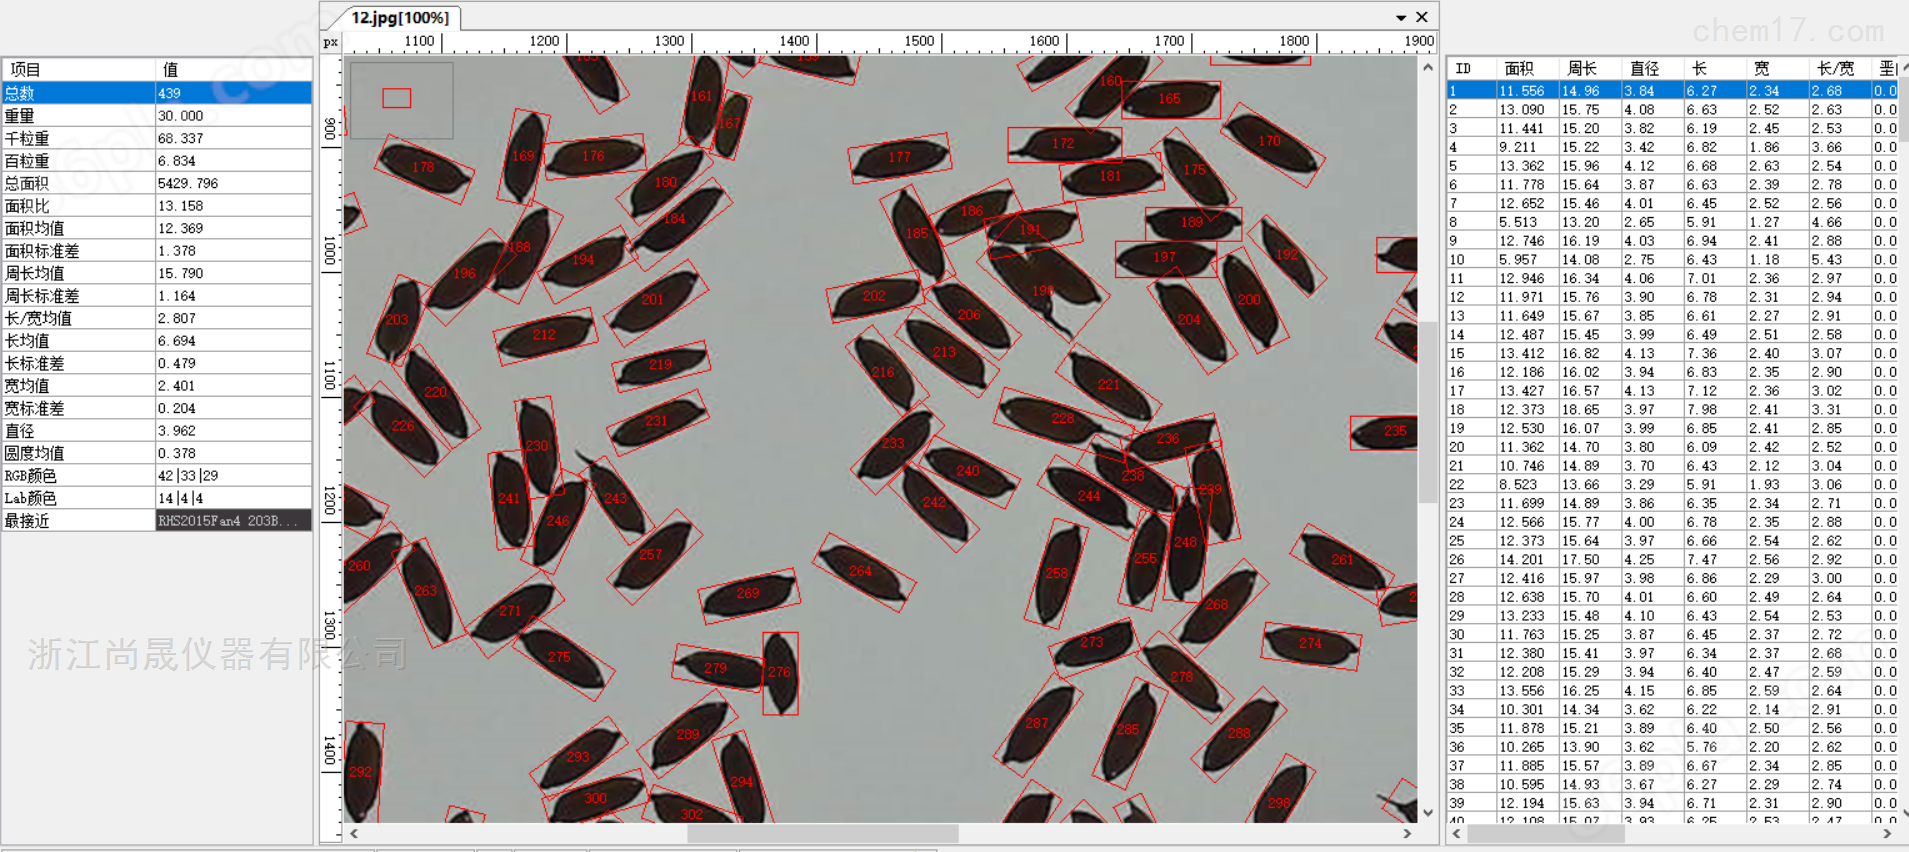
2. Image processing: Threshold segmentation and color enhancement segmentation can be performed on images, and erosion and dilation can eliminate the influence of impurities in the image on the results. You can record guide models for different types of samples and analyze them with just one click; You can also adjust the brightness, contrast, size, sharpening, and other aspects of the image.
3.Image analysis:Fully automatic counting speed:1~40000 pills/minute, counting error:≤±0.1503%,The precision of counting can reach99.8%, manualCorrected by Da99% correct;Accuracy error of thousand particle weight analysis:≤±1mg;Can analyze the sampleLength, width, aspect ratio, area, perimeterWait for phenotypic indicators,andThe sample to be testedaveragephenotypevalue, and sort the output,Among them, particle type error≤±0.3mm,.cansamplePerform deep learning on different target colors and shapes, and record classification guides to achieve automatic classification features; Batch analysis of imaged images is possibleSave the data on the same sheetIn SCV.
4.Sample naming:Tested sampleproductif there isbarcodeOr QR code display can be connectedscan the QR codegunscanjustQuick inputsampleproductBarcode numberPerform automatic naming.
5. Weight output: The balance can be passed throughThe RS232 data cable is connected to the data processor, and after inserting the sample to be tested, the reading can be automatically transmitted to the data processing software for automatic conversion of thousand particle weight and hundred particle weight.
6.Seed Phenotype Analysis SystemData output: toOutput in SCV format and selectively output data to achieve comparison of main data, with data addition function. The analyzed vector graph can be classified by sample sizeLength, width, aspect ratio, area, perimeterWaiting for phenotypic indicatorsArrange output images, automatically generate a total report, and output statistical analysis results toSCV table.
7. Auxiliary functions:manuallyChoose to add/Delete,Ensure the accuracy of data,Target area can be set for analysis.
8.Product configuration: Data processing softwareEncryption devicesHigh resolution imaging equipment, imaging disc, balance, and computer need to be separately equipped.
Similar Product Recommend